Machine Learning Module
Claudia Donahue 2022-07-14
Learning About Machine Learning
We just finished the course’s section on Machine Learning. We did a little bit of unsupervised learning, but mostly supervised learning, meaning we were trying to predict a target variable, versus just looking for patterns and relationships in the data.
Supervised Learning
We covered the standard regression model and then generalized linear models to predict (or classify) a target variable. Then we worked on nonlinear methods and ensemble learning.
Unsupervised Learning
Finally, we looked at two methods of unsupervised learning, principal components analysis and clustering.
What I Liked Most
In this module, I would say the classification trees were most interesting to me. A commonly used example seems to be using the data containing characteristics of passengers on the Titanic to predict whether each one survived the ship sinking. I like that you can output a decision tree, and then follow along that tree to make a prediction on an observation. I think that sort of visualization alone can be quite useful in highlighting feature importance.
I liked using the caret package because it simplified training a huge
variety of models. Here we will fit a model using caret::train, and
then display a visualization of the resulting tree to show how cool it
is as a tool to understand the importance of different variables. We are
predicting survival based on variables like age, passenger class, ticket
fare, and sex:
library(caret)
fit <- train(x = training[,2:8],
                y = training[,1],
                method = "rpart",
                preProcess = c("center", "scale"),
                cp = 0.001,
                trControl = trainControl(method = "cv",
                                         number = 3)
                )
# Plot the tree using the rattle package
library(rattle)
fancyRpartPlot(fit$finalModel)
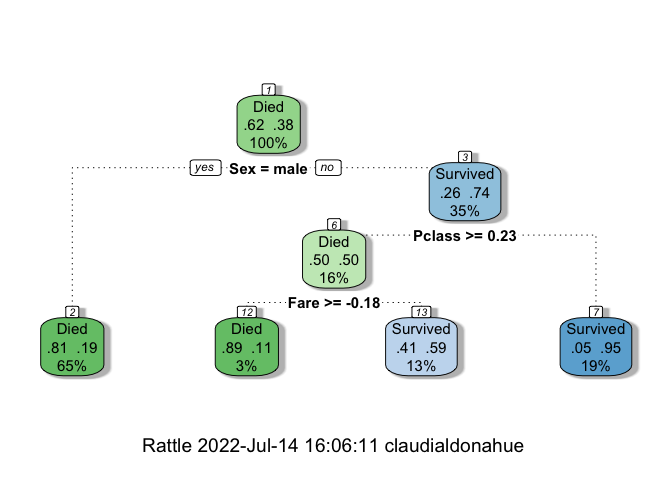
You could take your own characteristics, for example, and follow through
this tree to get a prediction on whether you would have survived the
sinking of the Titanic. If you are ‘male’, it is pretty simple. 81
percent of males passengers died. If you are a female, the models
predicts your survival only if you had a higher Pclass ( passenger
class) or paid more for your passenger fare.
More on Why I Like Classification Trees
As I begin working on my final projects for both my summer courses, two great datasets I’m eyeing are:
-
one from the NTSB (National Transportation Safety Board) on airplane crashes and fatalities. I like to fly, and potentially may buy a small plane at some point. I want to pick one that not only is affordable for me, but also that would keep my family and me alive in the event of an mishap.
-
a second on vehicles colliding with cyclists and pedestrians in North Carolina. I am hopeful that research can lead to evidence-based improvements in my local community, like more funding and increased safety measures for alternative transportation.
A decision tree with this sort of data may enable a community leader to plug in locally relevant observations (themselves/their neighborhoods/their grandkids) and understand the likelihood of bike/pedestrian fatalities if nothing changes. They could get an idea where in the community bike/pedestrian funding would make the largest impact.
Hopefully I can use the skills I’m gaining this summer to make a positive impact!